Are you keeping an eye on the right attendance metrics for student success?
.png)

One of the best strategies behind improving student attendance is by grounding your team in real time data. When informed with the best data, your team can develop more effective interventions and supports and take preventative measures informed by concrete evidence.
In our world of information overload at every turn, it can be overwhelming to know which data to pull, observe and track on a regular basis. Read on for strategies to help you tune out the noise and efficiently use your precious time to analyze the right data.
Year to Date Attendance & Chronic Absenteeism Rates
These metrics are not just a way to measure the overall health of your school, but can help you set informed attendance goals.
Chronic absenteeism rate, defined as the percentage of students enrolled who have missed 10% or more days of school, can give you insight into challenges that may have been formerly overlooked. Oftentimes, a high attendance rate can mask a high chronic absenteeism. It’s similar to the way that a high average 8th grade math score can overshadow the students who are struggling and need extra help.
Monthly Attendance & Chronic Absenteeism Rates
This allows your team to view any emerging patterns and trends within specific months. For example, did the chronic absenteeism rate increase in October, then decrease in November? What may be the root cause? Being able to identify these challenges allow teams to develop targeted campaigns that can turn the numbers around.

Percent & Number of Students by MTSS Tier
By viewing the percent and number of students in each attendance tier, you can further focus and prioritize resources and supports as you design Tier I, Tier II and Tier III interventions:
Tier I:
- Regularly attending: 0-4.9% Absence rate
- At-Risk: 5-9.9% Absence rate
Tier II:
- Chronically Absent: 10-19.9% Absence rate
Tier III:
- Severely Chronically Absent: 20-49.9% Absence rate
- Extremely Chronically Absent: 50% and above Absence rate
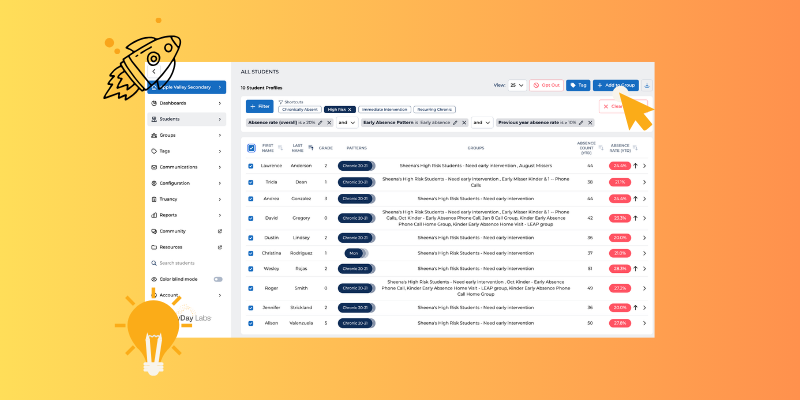
Alongside tracking the number of students and the percent of your student population falling into the categories above, it can be extremely helpful to access lists of students that fall into these tiers for easy intervention group creation and coordination.

When tracking the right data, it is much easier to provide the right intervention to the right student, bringing you one step closer to student success at your school.
Click here for more information on EveryDay Pro, our new attendance platform that provides best-in-class attendance analytics and intervention coordination tools for smart attendance teams.
Explore Our Latest Insights
Stay informed with our recent blog updates.

Your May Game Plan: Wrapping Up the Year & Prepping for the Next
In this month’s virtual professional learning session, delivered just for our EveryDay Platform users, we covered strategies to wrap up the school year with strong attendance and simple ways to get our ducks in a row for the 26-27 school year. If you’ve got year-end attendance work on your mind, read on, because we’re sharing the highlights in this multimedia blog post!
Intervention Management Made Simple with the EveryDay Platform
Whether you’re just beginning to address absenteeism through some new strategies, or already have a comprehensive, tiered approach in place, you need access to the right tools to create high-impact interventions, stay organized, and track your progress. That’s why we designed the EveryDay Platform to not only provide the most helpful attendance analytics, but also support educators with the intervention management tools to help move attendance work forward.
Join Our Community of Learners
Stay updated with our latest insights and share your thoughts with fellow educators and parents.
